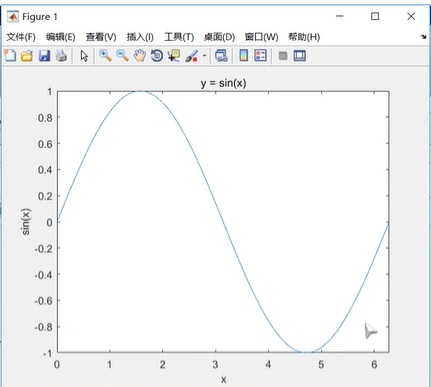
x = 0 : 0.01 : 2 * pi;y = sin(x);figureplot(x, y)title('y = sin(x)')xlabel('x')ylabel('sin(x)')xlim([0 2*pi])
说明:
xlim([0 2 * pi])限制了图像中x轴的长度,长度为 [0 2*pi]
image-20220729171222070
x = 0:0.01:20;y1 = 200*exp(-0.05*x).*sin(x);y2 = 0.8*exp(-0.5*x).*sin(10*x);[AX,H1,H2] = plotyy(x,y1,x,y2,'plot');set(get(AX(1),'Ylabel'),'String','Slow Decay')set(get(AX(2),'Ylabel'),'String','Fast Decay')set(H1,'LineStyle','--')set(H2,'LineStyle',':')